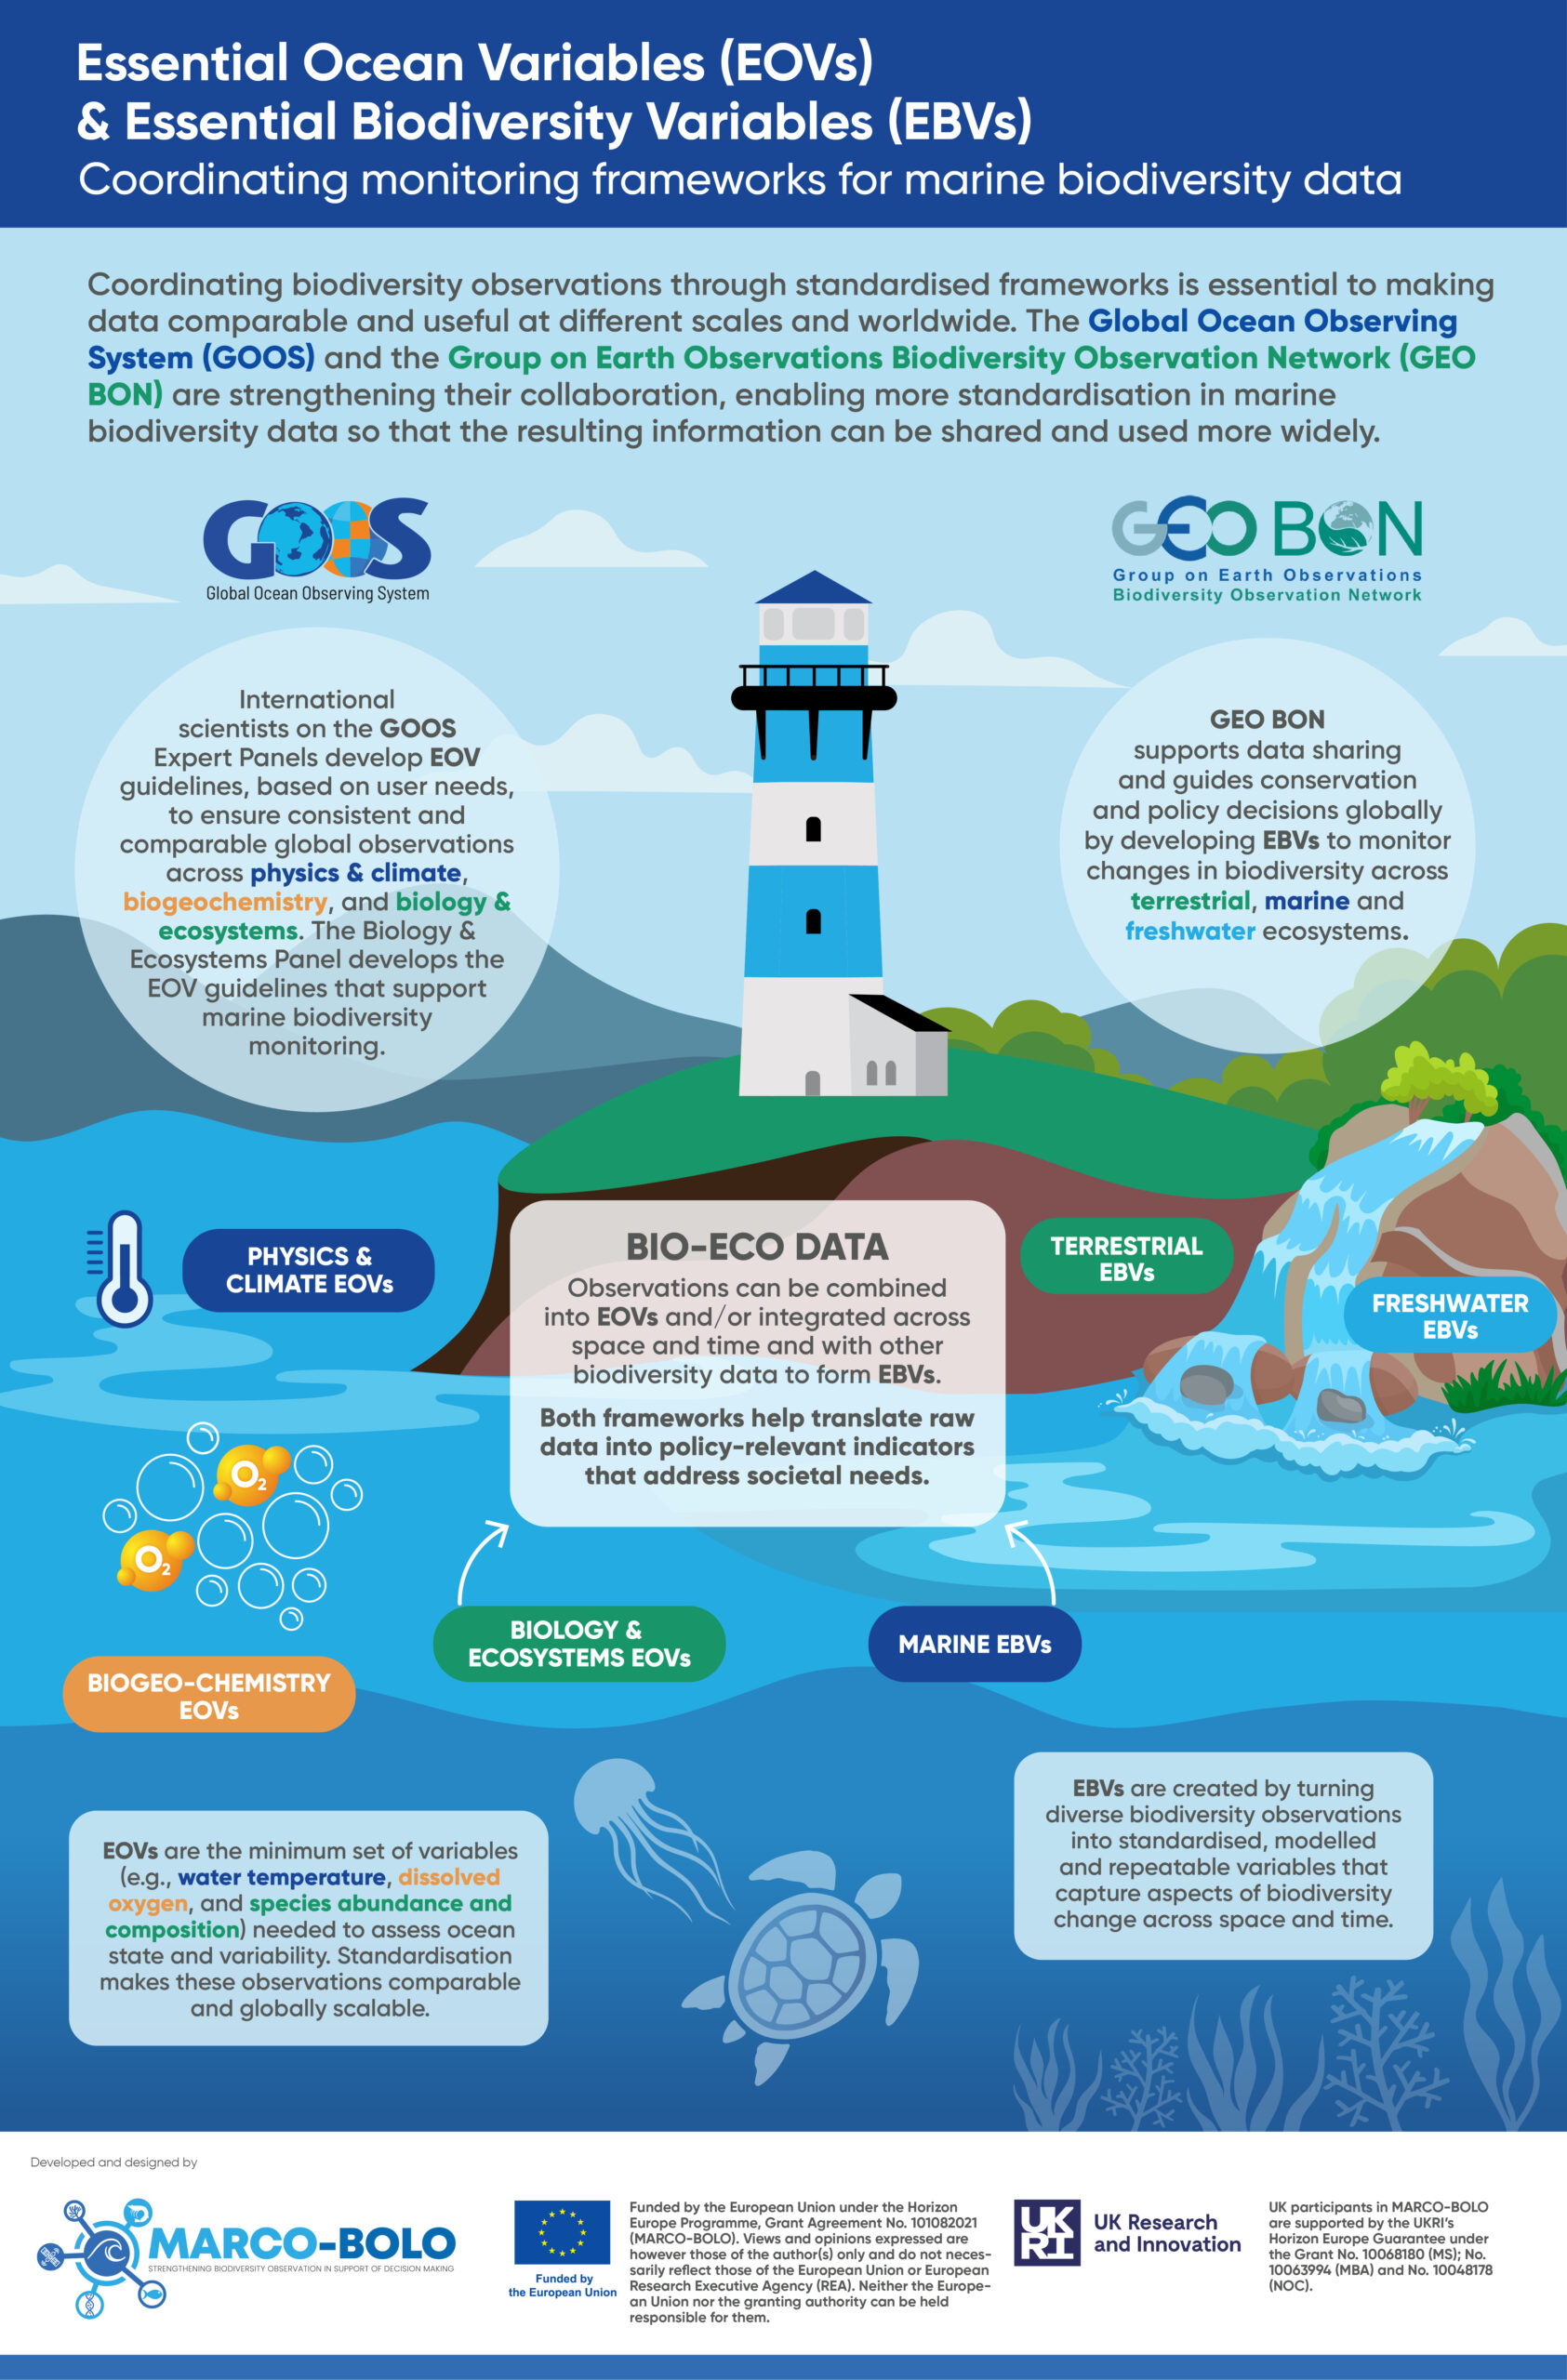
We are pleased to share the fourth infographic in the MARCO‑BOLO infographic series, focusing on the link between Essential Ocean Variables (EOVs) and Essential Biodiversity Variables (EBVs).
This infographic brings together the key concepts introduced in the previous three infographics and shows how physical, biogeochemical, and biological ocean observations can support biodiversity monitoring across scales. It aims to clarify how EOVs and EBVs complement each other, and how they are used within global observation and monitoring frameworks.
With the publication of this final infographic, the full series is now available on the MARCO‑BOLO website: https://marcobolo-project.eu/eovs-ebvs-infographics/
The infographics are designed as standalone resources and can be used for presentations, training, communication activities, or general awareness‑raising. They are intended for a wide audience, including researchers, practitioners, and policy‑relevant communities working on biodiversity monitoring and ocean observation.
We encourage you to explore the full series and share the infographics widely!